CitiBike Spatiotemporal Ridership Analysis
NYC, April - June 2024
Project Overview
Analysis and prediction of NYC CitiBike ridership patterns using historical trip data, weather observations, and geospatial neighborhood data across April-June 2024
This project aggregates ~5 million individual trips into hourly station-level counts, merged with weather and spatial data. This dataset is then analyzed and used to build predictive models to understand what drives ridership demand.
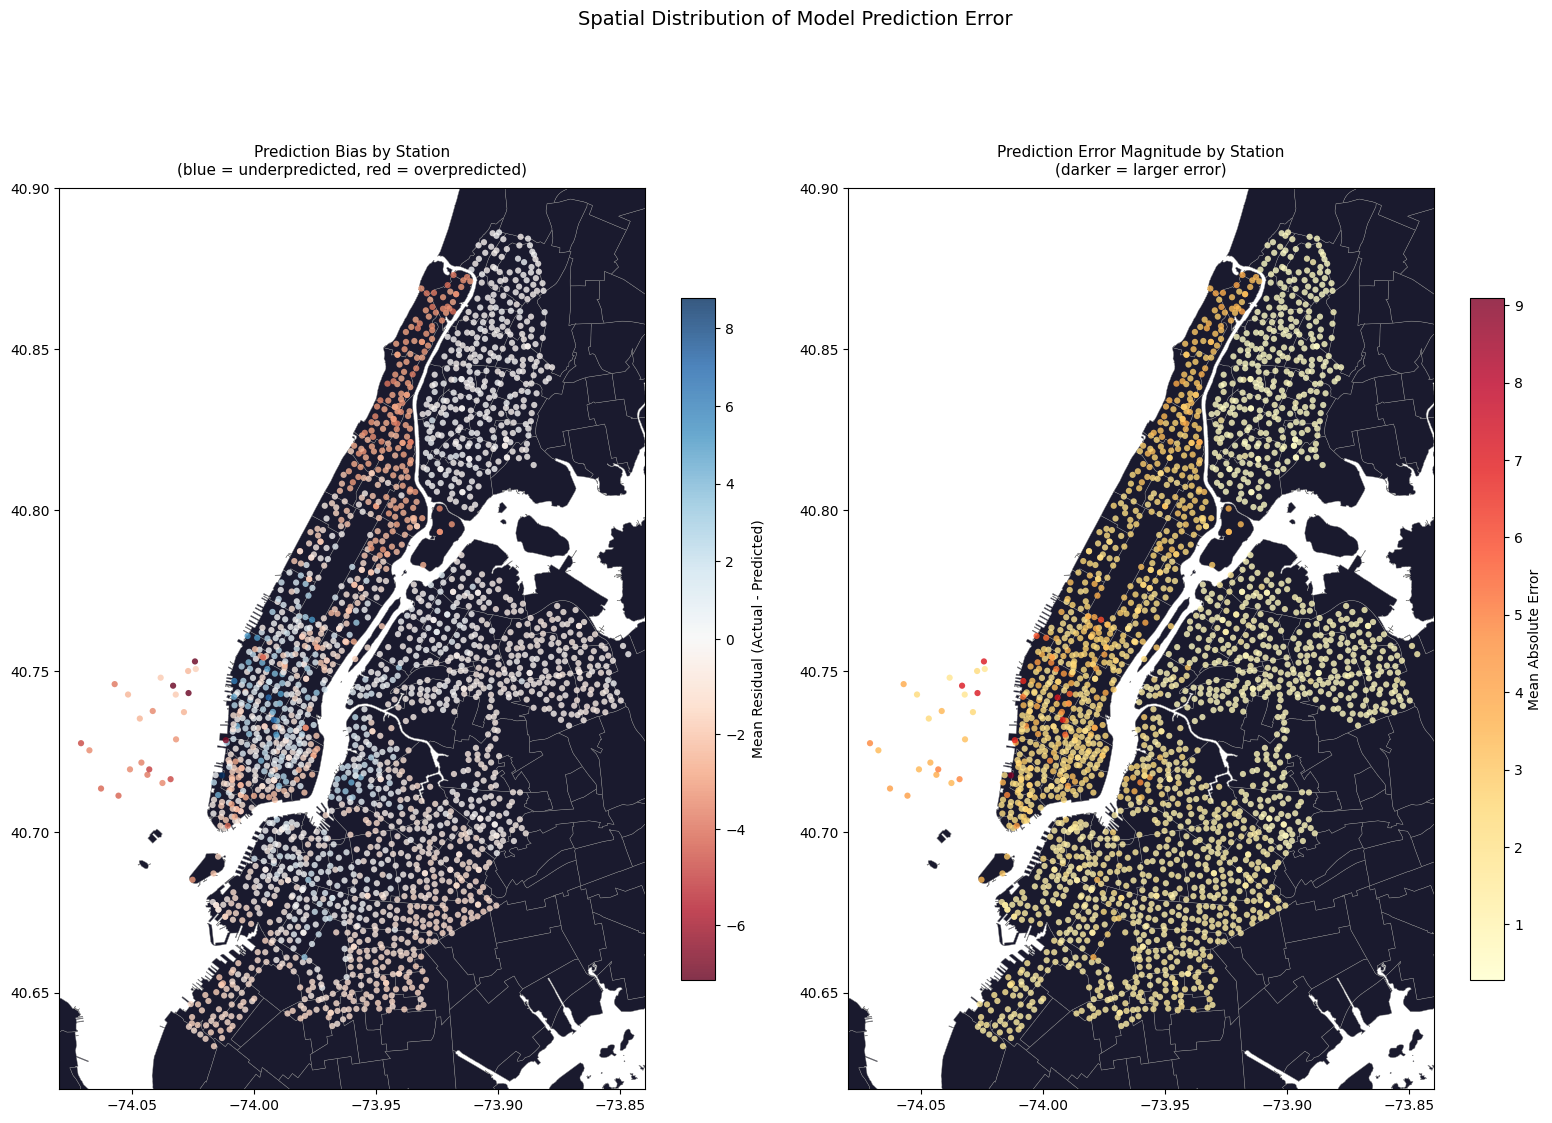
Key Findings
| Finding | Value |
|---|---|
| Rain ridership reduction | 16.5% |
| Rush hour multiplier | 1.40x |
| Electric bike share | 65% |
| Best model R² | 0.192 |
| Baseline RMSE improvement | 10.35% |
| Pier 61 flow imbalance | 6x network average |
Dataset
- ~5 million CitiBike trips aggregated to 1.9M hourly station observations
- 2,289 active stations across NYC
- Merged with NOAA hourly weather and NYC geospatial neighborhood data